Intangible assets, a source of out-performance
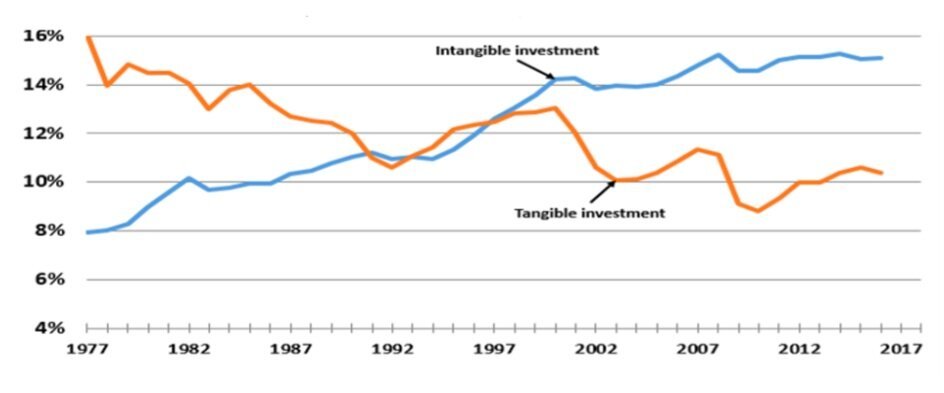
Investments in intangible assets – such as research and development, patents, technology and processes – have increased significantly over the last 30 years. Starting from a low base in the 1970s, private industry investment rates in intangible assets exceeded that of tangible assets during the 1990s. It continues to increase whilst investment in tangible assets continues to decline.
Figure 1: Rise in intangible asset investment rate in the US, 1977 to 2018. Graph from Baruch Lev and Anup Srivastava, 2019, Explaining the Recent Failure of Value Investing (p.8), NYU Stern School of Business
In 2018, an Aon report estimated that 85% of the enterprise value on the S&P 500 consisted of intangible assets; this compares to 17% in 1975. In the same report, despite the significance of intangible assets in today’s economy, 88% of senior investment decision-makers found conventional valuation methodologies such as discounted cashflows inadequate for valuing intangible assets. This is perhaps due to the complexity, heterogeneity and inability to convert intangible assets readily to cash. For example, how do you value an R&D pipeline of one biotech company and compare it to another? The task is much simpler for tangible assets such as buildings and property which are much more homogeneous, readily convertible to cash, and current accounting standards are adequate. Given the accepted challenges of valuing and interpreting intangible assets, but its importance in today’s economy, we think that a better understanding of intangible assets has the potential to deliver financial returns for investors.
Baruch Lev of NYU and Anup Srivastava of University of Calgary found that investing in companies that invested in intangible assets was a source of out-performance for value investment managers. Value investing comes in many forms, but it typically involves buying stocks that are trading at a significant discount to asset values or earnings. These opportunities tend to arise when companies experience short-term business challenges and the stock is sold off as investors assume those negative conditions will continue. Inevitably business conditions improve, and the market realises that the challenges that the company faced previously were short-term in nature, and the stock price recovers. Despite the logic of this strategy, and its success in prior decades, it has under-performed significantly since 2008. However, Lev and Srivastava argue that value investors have been underestimating the value of intangible assets, and had they accounted for it, would have enjoyed a 68% improvement in returns. In prior decades, this strategy was successful (without needing any adjustments for intangible asset values) perhaps because intangible assets were still in its infancy as shown in the Aon report cited above.
For value investing to work, it is expected that business conditions and stock prices will be cyclical and mean reversion will prevail. Poor performers today are expected to improve in the future. Lev and Srivastava found however that stocks have been slow to revert to the mean again, contributing to the poor performance of the value investing style. Despite the slow mean reversion that they observed, they did find that companies had a much better chance of ‘mean reverting up’ and improving their business and stock performance if they invested in innovation and themselves. Tangible evidence that intangible assets can drive shareholder returns.
Our investment research focuses on a company’s operations, its people and culture as we think that they are factors that contribute to intangible asset value creation and therefore long-term shareholder value creation. Currently not well covered by market participants, we believe these should be important areas of focus for investors.
This note has been prepared by ELM Responsible Investments (‘ELMRI’) ABN 70 607 177 711 AFSL 520428, for Australian wholesale clients for the purposes of section 761G of the Corporations Act 2001 (Cth).
The information is not intended for general distribution or publication and must be retained in a confidential manner. Information contained herein consists of confidential proprietary information constituting the sole property of ELMRI and its investment activities; its use is restricted accordingly.
This note is for general informational purposes only and does not purport to be comprehensive or to give advice. The views expressed are the views of the writer at the time of preparation and presenting and all forecasts, assumptions, opinions, data and other information are not warranted as to accuracy or completeness and are subject to change without notice. This is not an offer document and does not constitute an offer or invitation of investment recommendation to distribute or purchase securities, shares, units or other interests to enter into an investment agreement. No person should rely on the content and/or act on the basis of any material contained in this note. Any potential investor should consider their own circumstances and seek professional advice.
ELMRI funds, its directors, employees, representatives and associates may have an interest in the named securities.
Past performance is for illustrative purposes only and is not indicative of future performance.

